Make data visible and use for social good
At the ViT Foundation, we focus on making complex information clear and accessible through data visualization. We strive to increase transparency and help communities make better, informed decisions by offering guidance on visualization methods and promoting data-driven visual communication.
Our collaborations
-
![Tte World Water Map by National Geographic]()
National Geographic Society releases updated World Water Map with enhanced data and future projections
The National Geographic Society has released the latest update to the World Water Map, a key component of its World Freshwater Initiative.
Developed in collaboration with Utrecht University and Esri, this advanced tool visualizes global freshwater supply and demand, highlights critical water gap hotspots, integrates more precise data, and introduces Future Water Gap Projections based on three socio-economic scenarios.
-
![]()
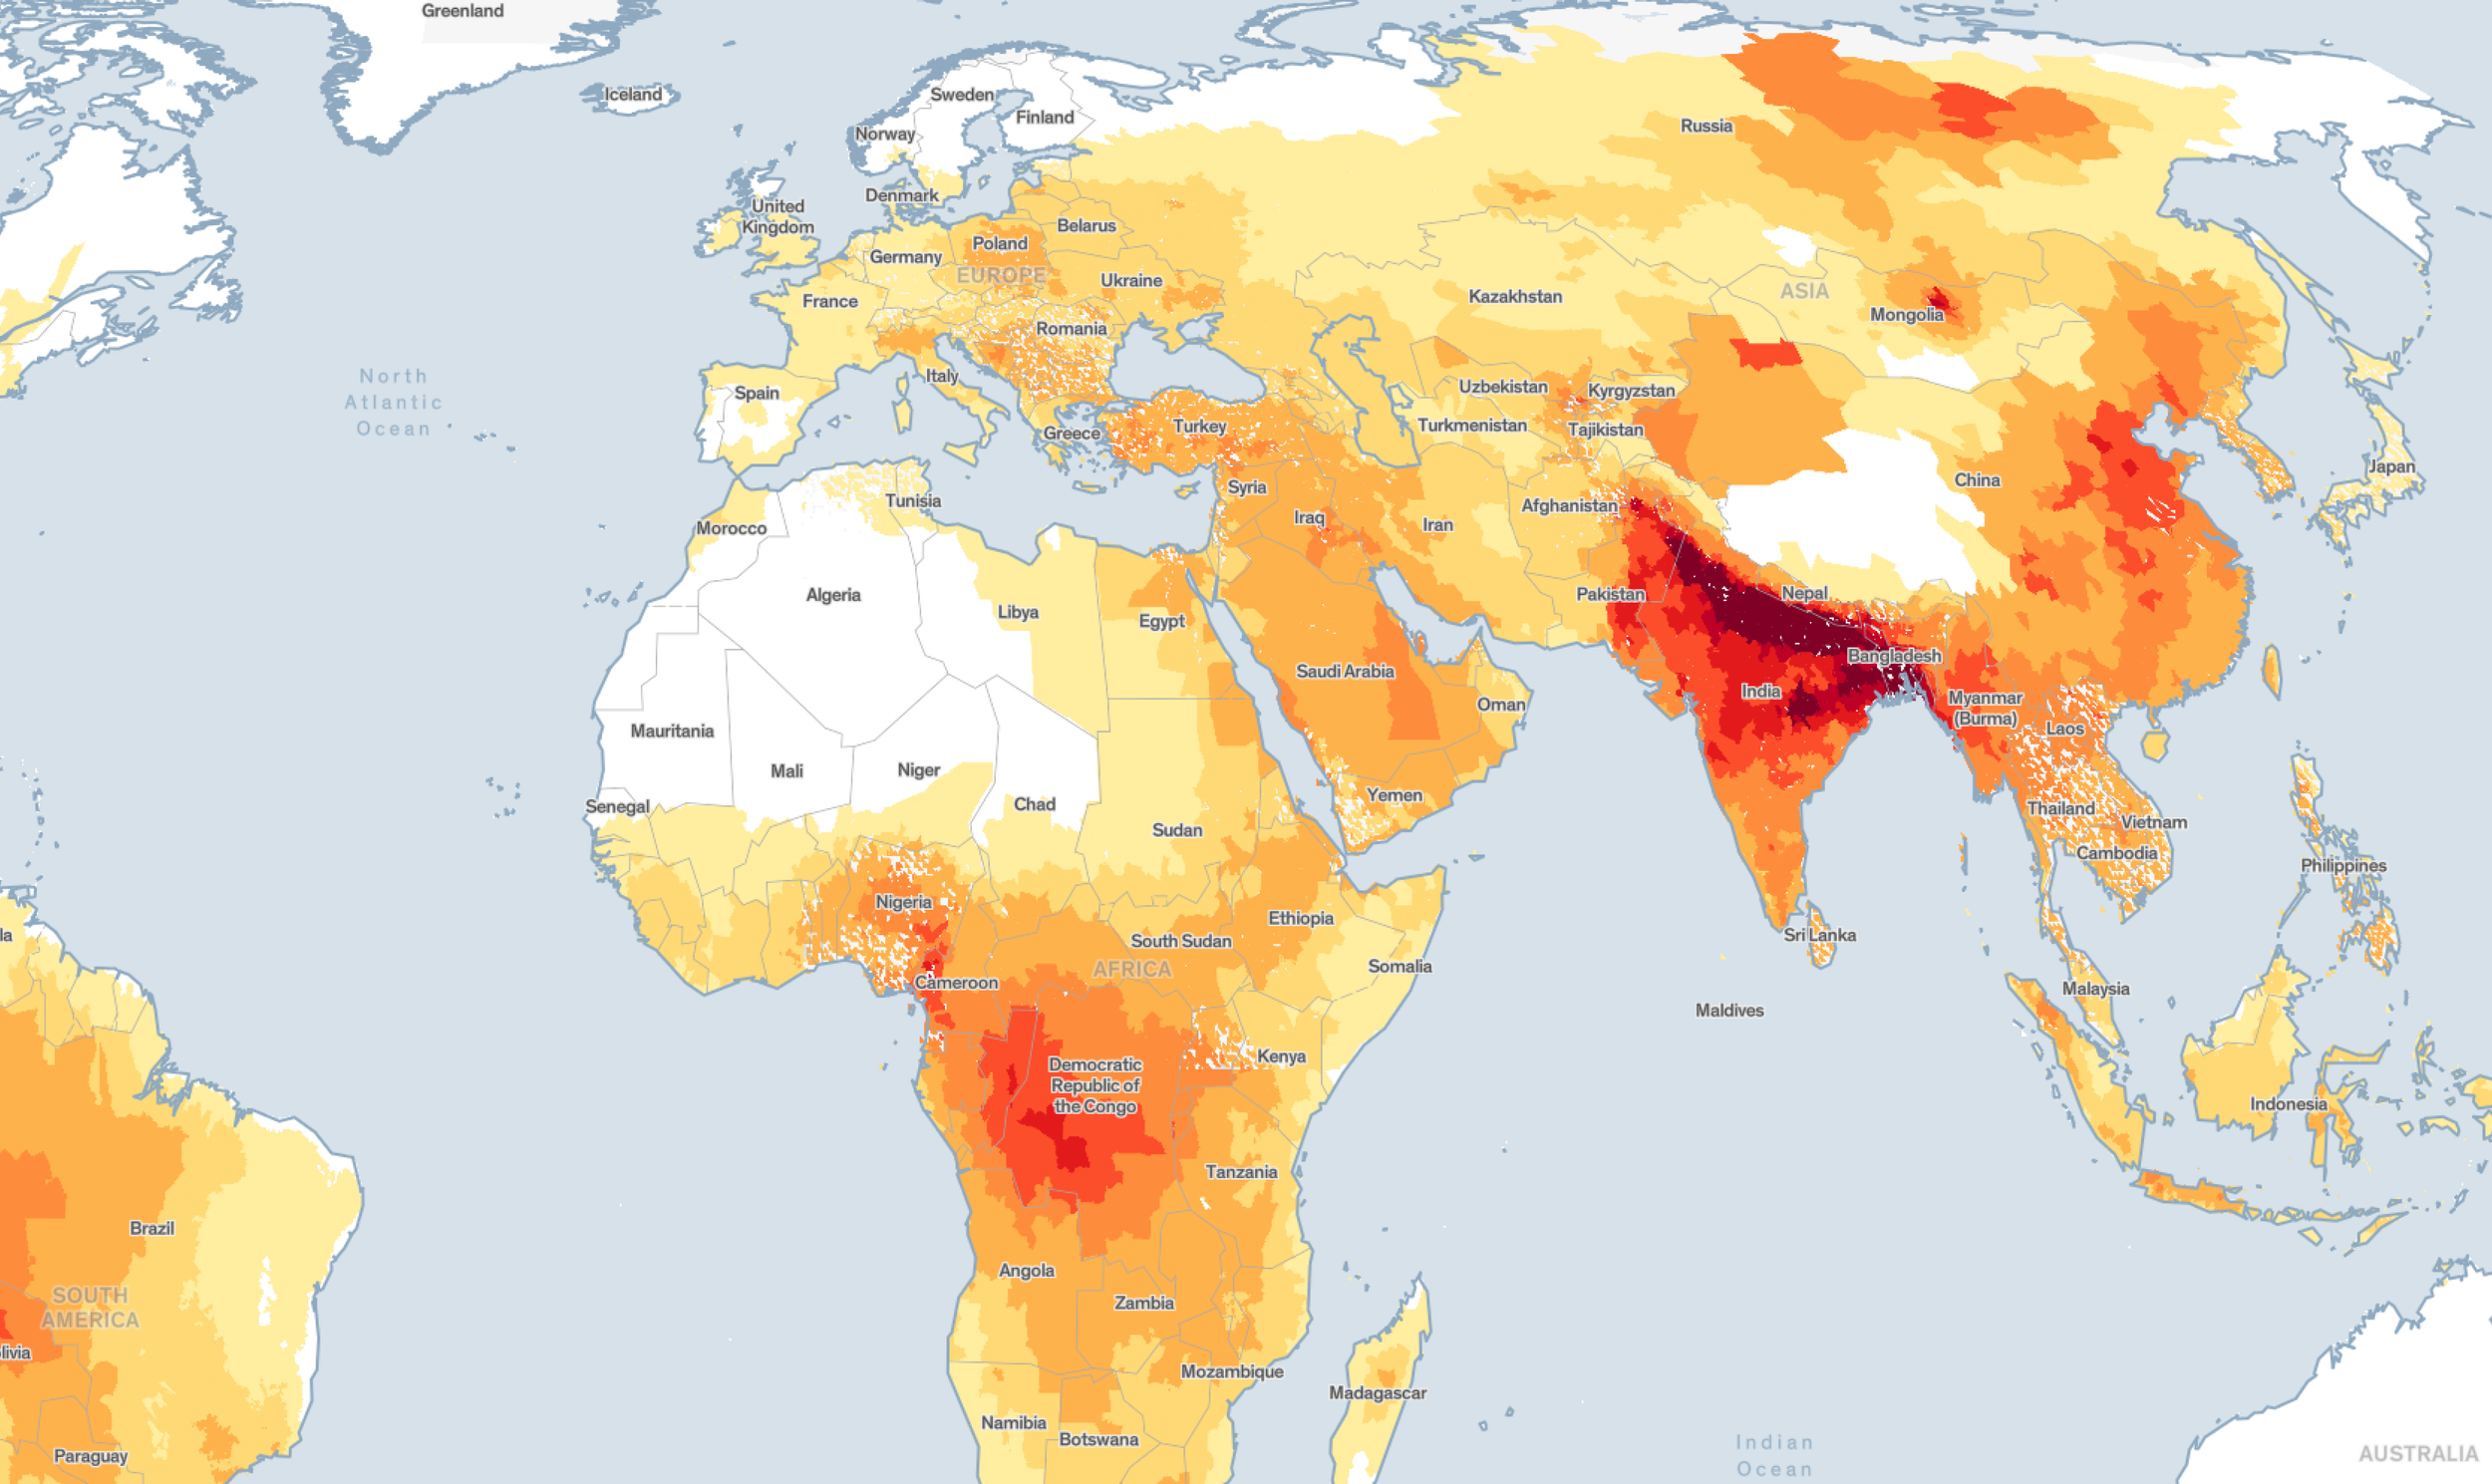
Air Quality Life Index: Visualizing Life Expectancy Gains through Cleaner Air
The Air Quality Life Index (AQLI) from the Energy Policy Institute at the University of Chicago (EPIC) translates through the interactive platform, air pollution concentrations into their impact on life expectancy. Policymakers —and the public— can now gauge the benefits of air pollution policies by the most important metric there is: longer, healthier lives.
-
![Manu, Peru, 2015 — Matsigenka boys fishing with barbasco root. Photo by Charlie Hamilton James]()
National Geographic Society launches a new tool to understand how people use water
The National Geographic Society launched the World Water Map as part of its five-year World Freshwater Initiative to better understand developing freshwater shortages around the world and inspire sustainable action. The Map was created in cooperation with Utrecht University and Esri to identify water availability hotspots, visualize global freshwater supply and demand
-
![Screenshots of the interactive tool, with maps and charts]()
UNEP's visual notes bring their Climate Emergency data into action
Our consultants collaborated in the visualization research and data analysis, as well as the design implementation of the visual notes. These interactives, by the United Nations Environment Programme, are data displays that contextualizea climate crisis and pollution metrics. They show and explain how the concentration of greenhouse gas (GHG) emissions in the atmosphere is wreaking havoc worldwide and threatening lives, economies, health and food, the different sources of air pollution, the health impact of outdoor air pollution, and what actions countries are taking to address the emergency.
-
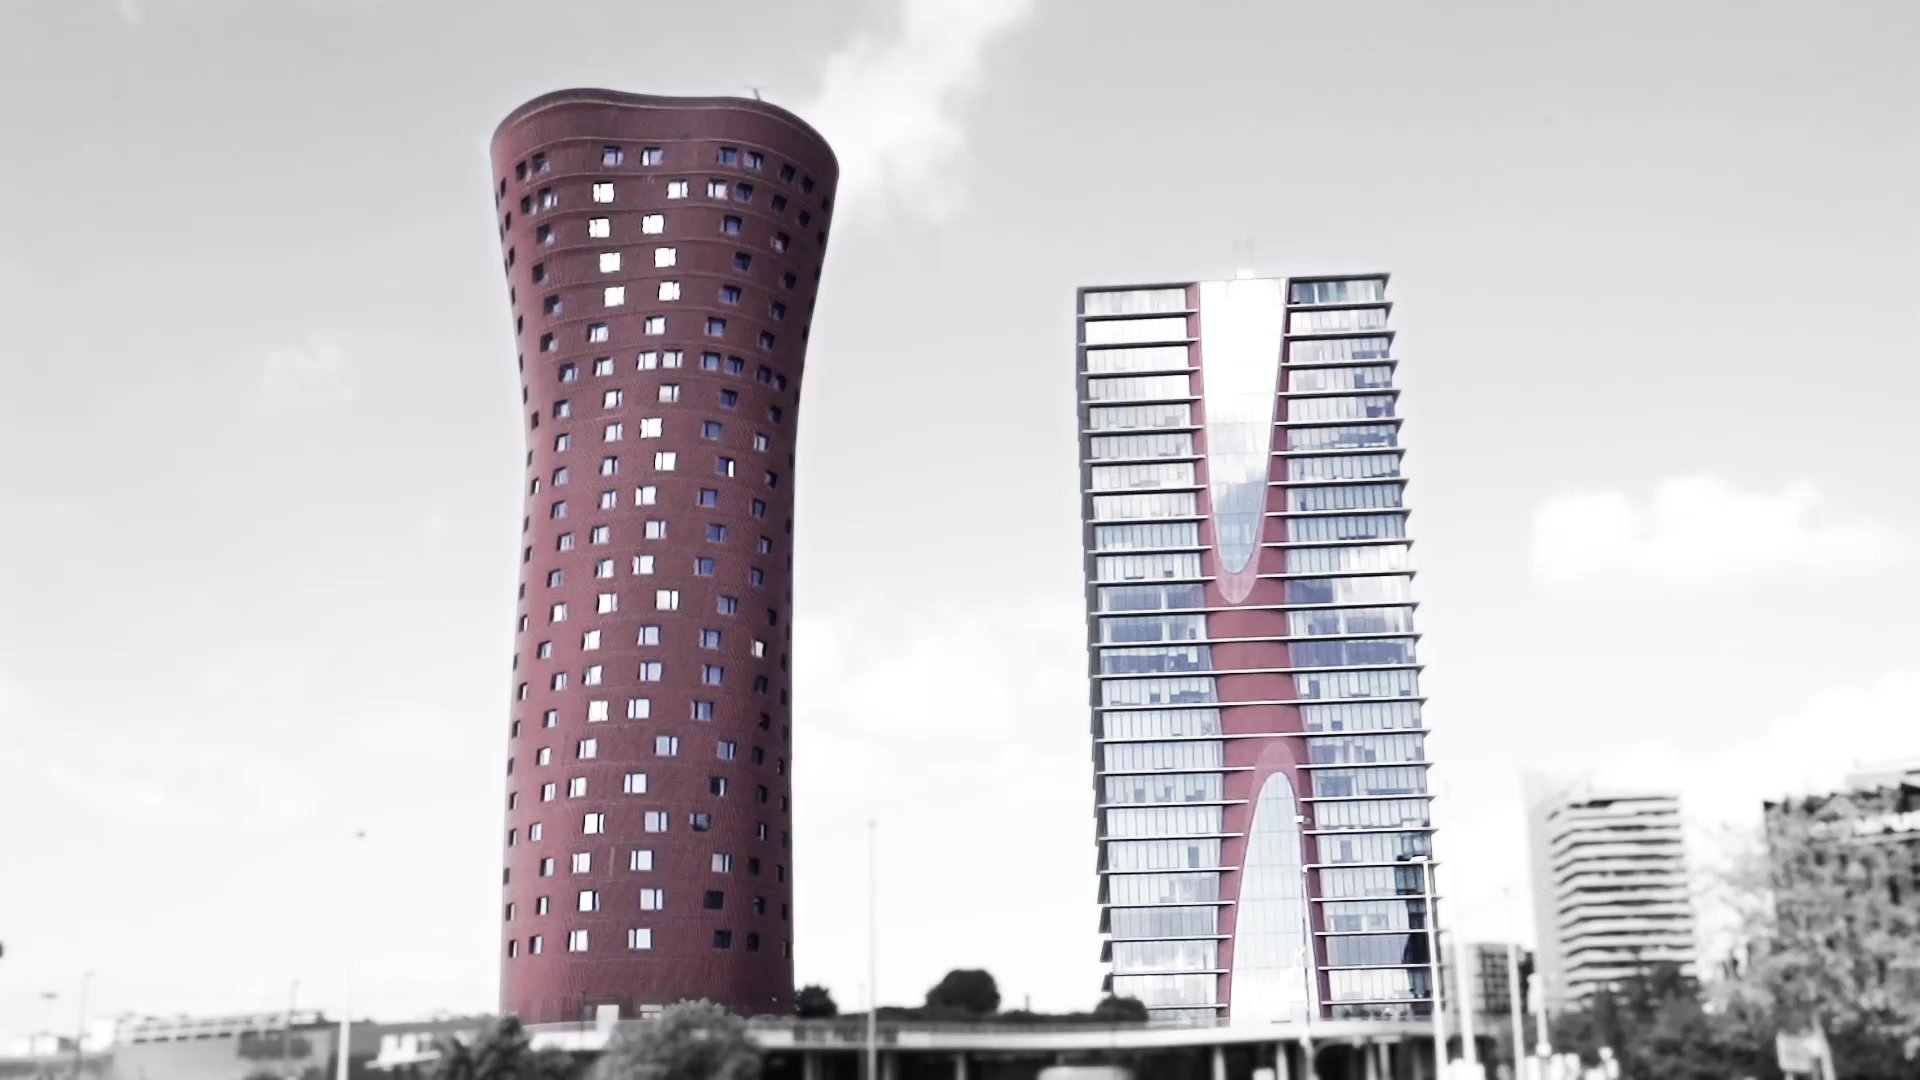
![Plaça Europa de L'Hospitalet de Llobregat. Foto de Rocío Minvielle]()
Un nou format interactiu per entendre la bretxa digital a L'Hospitalet
L’Ajuntament de L’Hospitalet presenta una nova eina interactiva per explicar als hospitalencs com és la bretxa digital a la ciutat.
Avui ens podem connectar a internet des de qualsevol lloc, a través dels telèfons mòbils, ordinadors o altres dispositius digitals. Però no tothom pot beneficiar-se de la mateixa manera, ja que hi ha diferents nivells d’accés i d’habilitats.
-
![]()
Here it is: MPAth
UNEP’s Marine Protected Area Tool Hub is an educational platform and repository developed to help community practitioners with their personalized challenges. It offers tools and resources structured around the MPA lifecycle stages to ensure effective and sustainable marine conservation efforts. The platform is intended to give local stakeholders and practitioners equitable access to knowledge and empowerment.
-
![]()
CIHI updates their toolkit to visualize the health of Canadians
We advised the Canadian Institute of Health Information on updating their visualization standards and tools. The institute provides information on Canada’s health systems and the health of Canadians.
Our collaboration helped them improve their internal capabilities to produce data-driven visual essays and update their tools, skill sets, and processes to create interactive charts.
-
![UNEP’s Climate Action Note]()
UNEP’s Climate Action Note
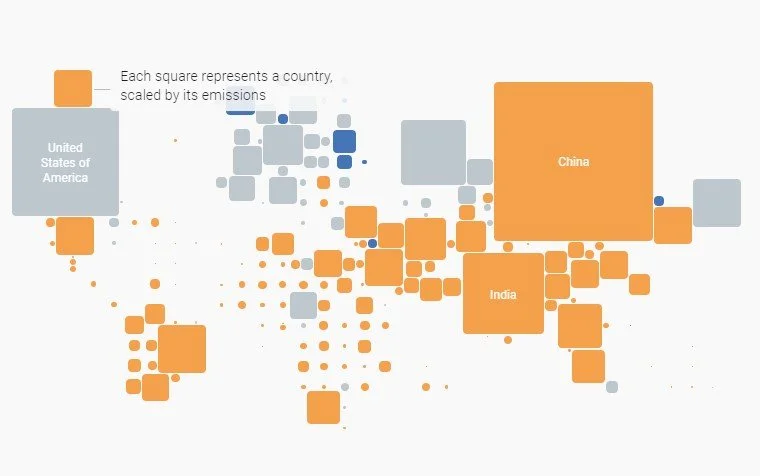
The UNEP´s Climate Action Note shows you the global state of the climate emergency and its development.
The world is in a climate emergency – “a code red for humanity” according to the United Nations Secretary-General. Review how GHG emissions for each country have changed since 1970, emissions per capita, and trends. Additionally, individual carbon footprints vary significantly and tend to align with wealth disparities. -
![National Geographic Society's emergency fund for journalists]()
Mapping the impact of National Geographic Society's COVID-19 Emergency Fund for Journalists
On March 27, 2020, the National Geographic Society launched an emergency fund to support journalists around the world who wish to cover COVID-19 within their communities.
Our pet projects
-
![]()
Premis Women Dataviz 2025
Els Premis Women in DataViz donen un reconeixement al talent femení en el camp de la visualització de dades. Adreçats a dones joves i professionals del sector, els premis valoren projectes que combinin innovació, narrativa visual i impacte social. Amb quatre categories i una dotació total de 4.500€, el projecte busca trencar estereotips, generar nous referents i impulsar vocacions femenines en el món del dataviz.
-
![]()
30 Days Woman Dataviz Challenge
El 30 Days Woman Dataviz Challenge és una iniciativa gratuïta per a dones, enfocada en la formació en visualització de dades. Durant un mes, les participants aprenen a comunicar dades obertes amb l’eina Observable per crear gràfics impactants i aplicar-los en projectes reals, mitjançant mini-cursos diaris amb reptes pràctics i suport d'expertes. La millor participant és amb 1.000€, com a reconeixement a la seva excel·lència.
-
![]()
IMCV: el indicador de la calidad de vida en España
Este proyecto reimagina la visualización de los datos públicos abiertos, basados el Indicador Multidimensional de Calidad de Vida (IMCV). Este es un índice compuesto desarrollado por el Instituto Nacional de Estadística de España (INE) y construido a partir de 60 variables estadísticas, agrupadas en nueve dimensiones, que ofrece una visión general de la calidad de vida en España.
-
![]()
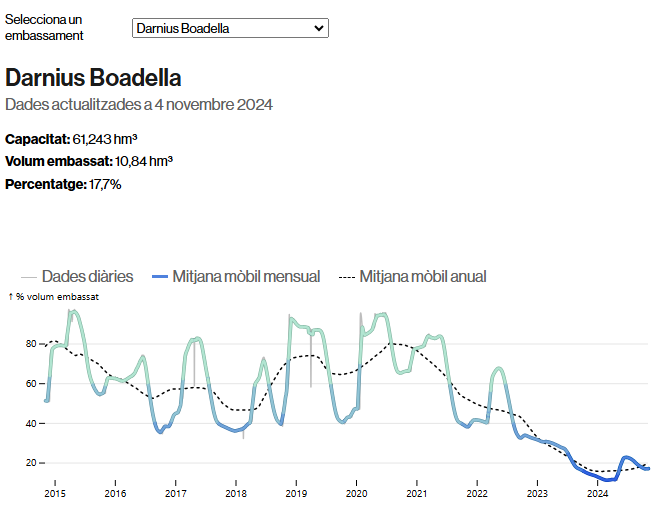
Catalunya en Dades: la sequera i estat dels embassaments
Explorem el potencial d'Observable Framework per redissenyar taulells públics de dades obertes al projecte Desembassaments de Catalunya. Hem reimaginat el panell de l'Agència Catalana de l'Aigua (ACA) sobre recursos hídrics, creant visualitzacions interactives que permeten analitzar l'estat actual i les tendències dels embassaments. L'objectiu és facilitar l'anàlisi de la situació hídrica i millorar l'accessibilitat dels dades per al públic.
-
![Catalunya en Dades: Reimagining Catalonia’s Open Data]()
Catalunya en Dades: reimagining Catalonia’s Open Data
The initiative Catalunya en Dades is an open call for collaborations to reimagine the Catalan open data portal one dashboard at a time using Observable Framework. Students and data enthusiasts are encouraged to participate actively, engaging with the data and showcasing their creativity. Prizes are awarded for outstanding contributions, recognizing the best contributions in this collaborative effort.
-
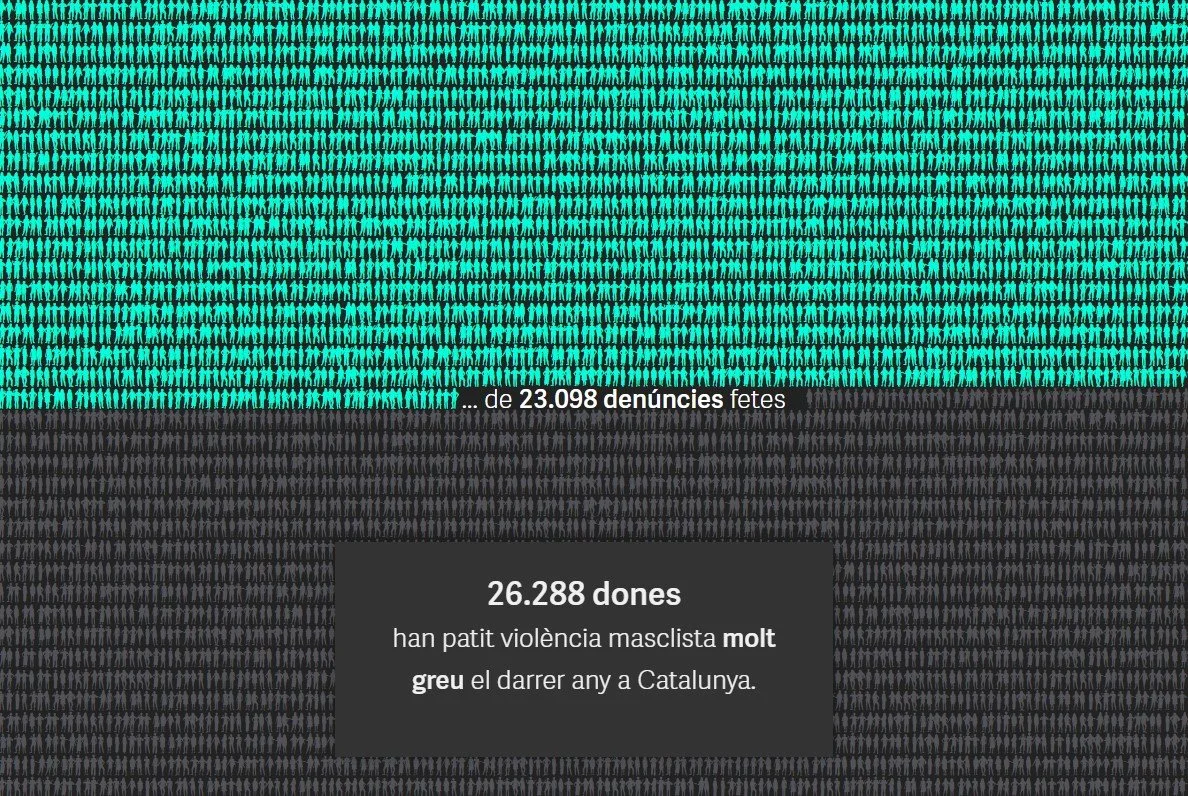
![Desprotegides, Malgrat tot: la violència masclista a Catalunya]()
Desprotegides, Malgrat tot: la violència masclista a Catalunya
El projecte Desprotegides, Malgrat tot aborda la violència masclista a Catalunya, on una de cada quatre dones ha patit violència greu.
Analitza l'eficàcia dels protocols d'atenció, els serveis d'acompanyament i les polítiques públiques, destacant les limitacions del sistema en la protecció de les víctimes.
The project was awarded a silver medal at the Malofiej Awards in the Digital Features category. -
![Infància desprotegida : les falles del sistema de protecció infantil a Catalunya]()
Infància desprotegida: les falles del sistema de protecció infantil a Catalunya
El projecte Infància desprotegida analitza les deficiències del sistema públic en la detecció, atenció i prevenció dels maltractaments i abusos sexuals a menors a Catalunya. Destaca l'incompliment de la llei 8/2021, la saturació dels serveis, la precarització laboral, i la manca de formació adequada, exigint un canvi urgent en l'abordatge d'aquestes violències.
-
![¿A qué ritmo vacunó España contra la COVID - 19?]()
¿A qué ritmo vacunó España contra la COVID - 19?
Durante la primera fase de la vacunación contra la Covid-19, en enero de 2021, no todas las comunidades autónomas vacunaron al mismo ritmo.
Para estimar el tiempo que tardarían en vacunar a la población, la ViT diseñó un informe automatizado y un repositorio en abierto para rastrear diariamente las diferencias de vacunación por territorio.
Our educational activities
-

Dataviz for Society Conference
The first Dataviz for Society Conference gathered experts in the data and information visualization field, to discuss how we can design tools that help us make better, more informed decisions, and visualizations that transform our understanding of the world. It was co-organized by the Digital Future Society and the ViT Foundation.
-

Master’s in Visual Tools to Empower Citizens
In collaboration with Universitat de Girona, we have set up a Master’s degree in Visual Tools for transparency addressed to engineers and data analysts.
There is a growing demand —and an urgent need— for a hybrid profile that merges design and computing. The public sector needs qualified professionals to design visualizations: from transparency tools for citizens to systems for data-driven understanding, exploration and decision-making.
Although the focus of this Master’s program is the public sector, the skills required to conceive and develop the projects will be transferable to other areas, ranging from interactive journalism to companies


